Coincidentally I was reading through the Chronicle of Higher Education Forum yesterday and came across this gem from 1994. “A Mathematical Model for the Determination of Total Area Under Glucose Tolerance and Other Metabolic Curves”, Mary M. Tai, Diabetes Care, 1994, 17, 152–154. The paper outlines a ‘new’ way of measuring the area under a curve by adding up areas of rectangles and triangles which the author calls Tai’s method. In fact the method described has been understood for centuries as is known as the trapezoid rule. (I use this method in statistics for humanities for calculating the Gini co-efficient.)
I’ve not heard about the paper before and the journal quickly published responses pointing out that this method was not new. However, the paper continues to be cited… and not only by people talking about it.
There is an interesting discussion of the paper on Stack Exchange about what should have happened to the paper. The first question might lie in wondering why no one out of the author, her colleagues, the reviewers or the journal editor had ever seen this before or something like it (I first remember coming across it in A-level Geography—pre 1994). On the other hand this demonstrates that it is perfectly possible for someone who has never seen as wheel to ‘invent’ the wheel, and the technique has been brought to a new audience, albeit about four centuries late.
This might be an extreme example, but I’m sure it’s not the only one of its kind. It begs the question though how much published research is genuinely innovative and how much is non-innovative stuff discovered independently.
Perhaps the most disturbing thing though is that twenty years later the paper is still being cited, and not just by people pointing out that this paper is nothing new. This paper from 2009 reads "Glucose and insulin areas were determined using Tai's model" (p.1046).
Yesterday, I was fortunate to attend a talk by David Pencheon of the NHS’s sustainable development unit.
A few of Dr Pencheon’s questions, thoughts and observations I noted:
1. Climate change not always best entry point for talking about sustainable development. We need to listen to what people are saying. He showed some of the usual graphs about past and projects CO2 emissions etc. – these don’t really engage people.
2. Intelligent life from another planet would be surprised about how much we know about ‘fouling our own nest’ and how little we are doing about it.
3. Climate change is a public health issue.
4. People have difficulty with numbers smaller than 0.5 and bigger than 25. Using huge numbers to provoke reaction not helpful.
5. Humans find it difficult to deal with things a long way away, things in the future and things which happen incrementally.
6. In the Paris heatwave of 2003 the biggest predictor of death was social isolation, not age. Even couples were found dead together.
7. Most surgical instruments used by the NHS are produced by child labour in Pakistan.
8. Hospitals are paid for activity, not outcomes.
9. People in ‘caregiving’ professions are no better than people in other professions. Often feel they are going it in ‘day jobs’. He includes educators and faith groups in this.
10. We need innovation, not increased efficiently. Increasing efficiency often means doing bad things differently.
11. Dr Penchoen visited a community in China where the people paid a small amount for the doctor only when they were well. This gave a the doctor an incentive to keep people well—in the NHS GPs and rewarded for doing certain sorts of activity.
12. Dying well – good health practices to extend the middle of life, not the end of it. Dr Pencheon was recently at a conference where GP’s indicated that helping people to die better was something of a priority.
Just come back from two weeks visiting family in Montreal. Turned off twitter email and email etc. and cut myself off from the world. Decided it was a good opportunity to do a bit of freewriting. I bought myself and notebook and just wrote from time to time without really thinking about it. Here are some extracts.
In Queen Mary "Second Cup" Saturday 16th of August 2014 about 5 PM (I don't have watch)
Been here about five days the phone still in flight mode. I've done a little Facebook and a few seconds of twitter, but otherwise I am cut off from the world.
No emails coming in from work. It still reads "31Messages". I've been downtown and am now sitting in the Second Cup in Queen Mary. Michelle and the boys are at a friend's afternoon for mum and kids... no one knows I'm here except those in the cafe who don't know who I am.
.
I can't help but Keep thinking about the iPhone being turned off. I fiffle with it an endlessly, surf Internet, check twitter, chat on Twitter, check Facebook make random comments on the other people's likes like your photos etc... right now I'm free really I don't need to be available there is nothing in the world I can do to save anyone's life. How many hours of my life I wasted fiddling with my phone? Additionally my sister-in-law no longer has TV in her flat. That too is a liberation
Went to Indigo again this afternoon- unlike the bookshop near McGill they had Graham Greene novels... hold off buying there are plenty in the University- library little in the way of Foucault either not sure why. Bought Handyman magazine, book of Canadian war posters, a set of three metal retro pens plus this pad...
The Statistics for Humanities book is now available in a much nicer PDF format. The mediawiki built website is still up there though it doesn't look great. The PDF is not perfect by any means but it’s time to move onto other projects now.
The book is published under a non-commercial Sharealike Creative Commons licence. I am thinking of trying an e-book version (I have software which technically supports this) but I fear that with all the images and mathematics this could end up being a big mess.
The first versions of the book (previously available for public consultation and rejected by the British Academy on the advice of their reviewers) were written in LaTeX. I actually learnt LaTeX for the specific purpose of producing the book. I liked the idea of programmatic control but it all got a bit difficult to control where graphs and images landed. GNU plot which integrates with LaTeX was great for making the graphs and I'll continue to use it in the future if and when the need arises.
The first website version has been written using mediawiki software (the same software behind wikipedia). Wiki markup is easy to learn and plugins mean that LaTeX can be integrated for the mathematical parts. One of the issues with websites is that appearance in browsers can vary, but it is still not as nice looking as wikipedia. The great advantage of wikis of course is that they are social tools in which people can collaborate to produce a finished product. I floated the idea with a couple of others of making this an open wiki, but was advised I could face problems of vandalism and spam. Although I like running websites it’s not a big part of my 'day job' and I don't want a troublesome hobby.
As I mentioned before the PDF version is available under a creative commons licence which allows people to modify it. This is all very well, but modifying a pdf document is not easy (that is sometimes the actual point), so I do need to think about whether I want to make the source files available. The book was produced using a combination of Serif Page Plus X7 (the full version) and MathType V6.9.
PagePlusX7 (I paid just under £64 including VAT) is not unlike MS Publisher though I much prefer it. I experimented with other desktop publishing software such as Scribus (free/ open source)*, but felt the learning curve was too steep at the present time. (High level DTPs run into hundreds of pounds so I'm not even going there).
Mathtype 6.9 (£43.20) was a worthwhile investment. I used it to type equations in LaTeX then copy and paste into PagePlus, but it can also be used to 'build' equations like the MS Equation Editor and even has a 'handwriting' feature. It can also be used in hundreds of other software applications. This was not totally plain sailing and for some reason equations using square root signs look a bit strange when posted into PagePlus. (If future editions of PagePlus have LaTeX Math integration that would be delightful).
Despite all the software used to produce the book, no software is necessary to use the book!
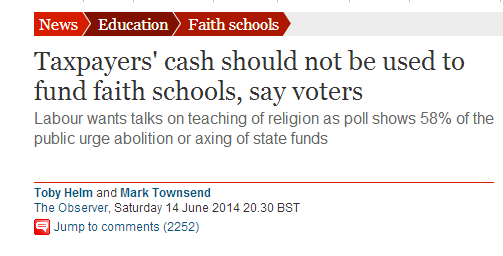
Taxpayers' cash should not be used to fund faith schools, say voters. Labour wants talks on teaching of religion as poll shows 58% of the public urge abolition or axing of state funds
The above headline in The Guardian intrigued me so I thought I would take a look at the actual questions asked. The survey was carried out by a company called Opinium on behalf of The Observer. On Twitter I tried to find out what questions were actually asked; interesting Richard Adams, Education Editor at the Guardian did not know, but said he would do some digging. I eventually found a pdf of the survey results on Opinium’s website.
In the interests of full disclosure I am a Christian with two children, one of whom is pre-school and the other attends a non-faith primary school. I did not attend a faith school myself. I’m not that interested in faith schools per se, but headlines such as the above invariably lead to debates about the relationships between religion and society that I feel duty bound to take an interest in.
The reason I’ve written this post is that I am very interested in questionnaire design. Questionnaire design is harder than most people think, but one would have thought a company which does surveys in its day to day work would be quite good at designing questionnaires. This one is so lousy I can only think it was politically motivated. It fact it is so bad I’m not entirely clear what the political motivation might have been.
Let’s start from the very beginning and take a look at Question 1. Respondents are asked to choose the opinion which is most like their own—note carefully -- not their opinion but the one that “best describes” their view of faith schools.
There are only three possible opinions plus a ‘Don’t know/ No opinion’ option.
The three available opinions are:
1. I have no objection to faith schools existing and being funded by the state
2. I have no objection to faith schools existing but they should not be funded by the state (i.e. private schools may be faith schools but not state schools)
3. Faith schools should be banned entirely
The best describes bit might be some sort of attempt to meaningfully take into account some of the nuances involved in such arguments but how views such as the following, which I suspect are widespread, fit into these three options.
1. I have no objection to faith schools existing and being funded by the state as long as they are only Christian/ CofE/ Catholic/ Muslim etc. (delete as appropriate)
2. I have no objection to faith schools existing and being funded by the state as long as they are NOT Christian/ CofE/ Catholic/ Muslim etc. (delete as appropriate)
3. I agree with faith schools but don’t agree with private faith schools because I don’t agree that there should be private schools.
4. I agree with faith schools as long as they don’t take their faith aspect too seriously.
5. I think all schools should be faith schools.
6. I agree with taxpayer funded faith schools as long as it’s not a really weird religion like…
As 1 and 2 above indicate there is really no such thing as a faith school, merely schools which are in one way or another connected to a specific faith, religion or belief system. Faith schools vary of course within faiths —Oasis academies, CoE voluntary aided village primary schools and ‘fundamentalist’ Christian private schools could all be described as Christian faith schools but they are certainly not the same in their ethos.
Question 5: In your view, how serious a risk is there of some predominantly Muslim schools encouraging their pupils to adopt extremist views?
1.Very serious
2.Quite serious
3.Not very serious
4.Not at all serious
5.Don’t know/ no opinion
The only specific religion mentioned in the survey is Islam. I’m not sure how one could answer this question in any meaningful way. This is in the context of the recent ‘Trojan Horse’ controversy of course, the full facts of which have not really emerged. The ‘Trojan Horse’ schools are not faith schools, or Muslim schools, but schools in which most children (and their parents) identify as Muslims. Overall 74% of those questioned thought there was a serious risk (i.e. very serious or quite serious), but what do we mean by extremist views? Extremists, however defined do not need extremist schools to incubate their views and activities. A lot of teachers would probably feel they are being credited as having far more influence on young people than they actually have.
The footer from the pdf of the report.
A couple of further points: Although the findings are available there is a statement of confidentiality in the footer of each page. This may have been an oversight, or it might be a case that this data was never meant to be made public. I’ll assume the former until I have evidence to the contrary. It is also unclear how the survey was carried out, though it is possible to register with Opinium as a 'survey filler in' and I suspect people who fill in surveys are less likely to be in the ‘No opinion’ camp.
Whatever the truth the 58% figure does not strike me as particularly likely or unlikely—I’m not even sure if this is higher or lower than what I suspect would be the percentage of people disagreeing with schools having a religious ethos or culture. The Observer is evidently trying to influence the Labour Party on the matter of faith schools. I just wish they had designed a better survey.


 umanities